Pandas tips cool
Một số tricks cơ bản trong pandas
Import thư viện trước khi thực hiện code
1
2
3
4
import time
import threading
import concurrent.futures
import multiprocessing
Load dữ liệu
1
2
3
4
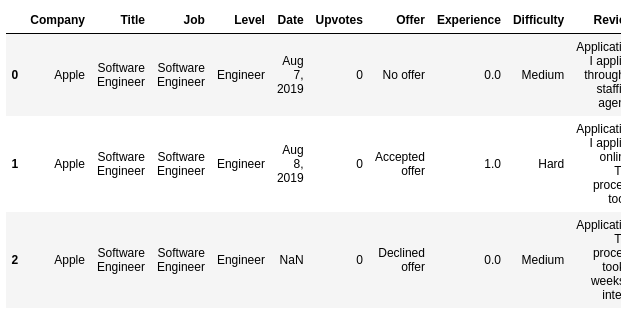
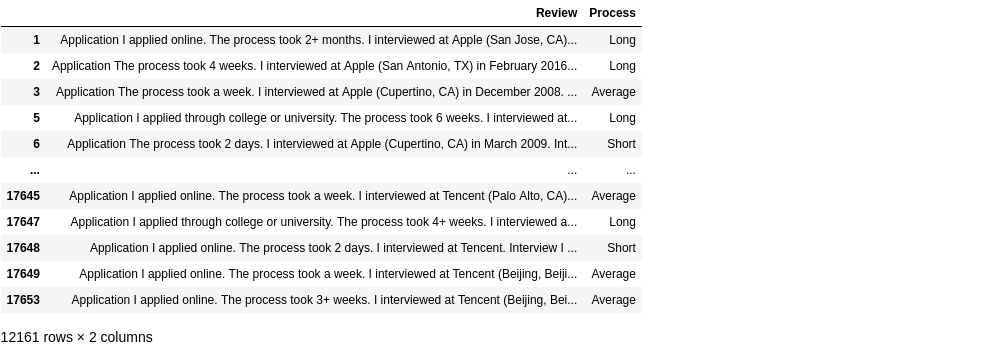
import pandas as pd
df = pd.read_csv('https://raw.githubusercontent.com/dophuchao/dophuchao.github.io/master/data/interviews.csv')
print(df.shape)
df.head(3)
Thay đổi dữ liệu a_ij hoặc cột nào đó
1
2
3
4
5
6
7
8
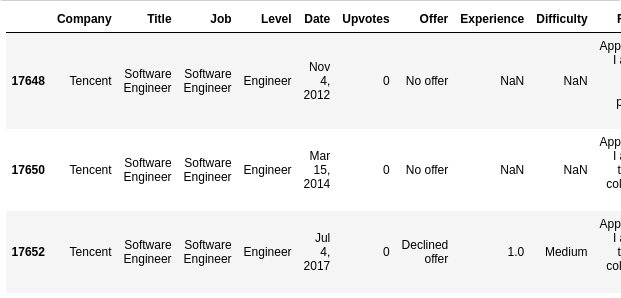
# use loc (function cua dataframe)
df.loc[0, 'Review'] = 'Orange is love. Orange is life' # row 0, col Review
df.head(3)
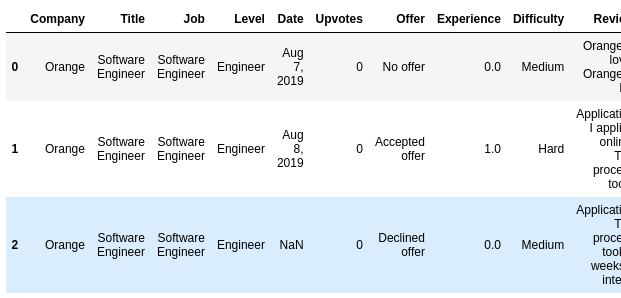
# change the company name Apple to Orange
#df['Company'] == 'Apple': tat ca cac hang cua cot "Company" la 'Apple'
df.loc[df['Company'] == 'Apple', 'Company'] = 'Orange'
df.head(3)
1
2
3
# set raise an error
pd.set_option('mode.chained_assignment', 'raise')
#df['Review'][0] = "I like Orange better"
Indexing and slicing
1
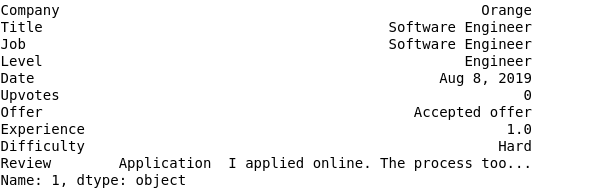
df.iloc[1] #hang thu 1
1
df.iloc[-6:] #6 hang cuoi cung
1
df.iloc[-6::2] #6 hang cuoi cung, nhay buoc 2
Select rows
1
2
3
4
5
#selecting rows
df.loc[df['Offer'] == 'Declined offer']
# or can write
mask = df['Offer'] == 'Declined offer'
df.loc[mask]
Create labels
1
2
3
4
5
6
7
8
9
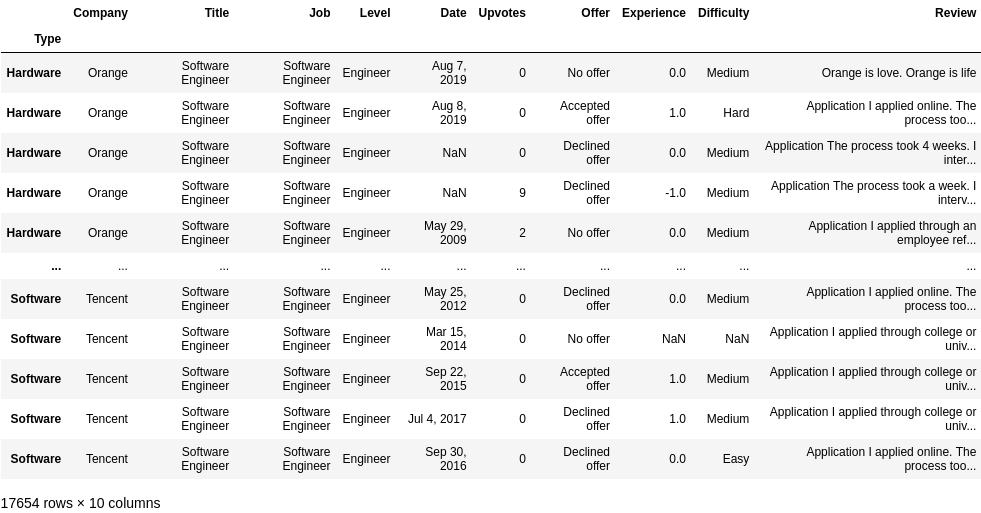
# creating labels
def company_type(x):
hardware_companies = set(['Orange', 'Dell', 'IBM', 'Siemens'])
return 'Hardware' if x['Company'] in hardware_companies else 'Software'
df['Type'] = df.apply(lambda x : company_type(x), axis = 1)
df = df.set_index('Type')
df.loc['Hardware']

Drop a label
1
2
3
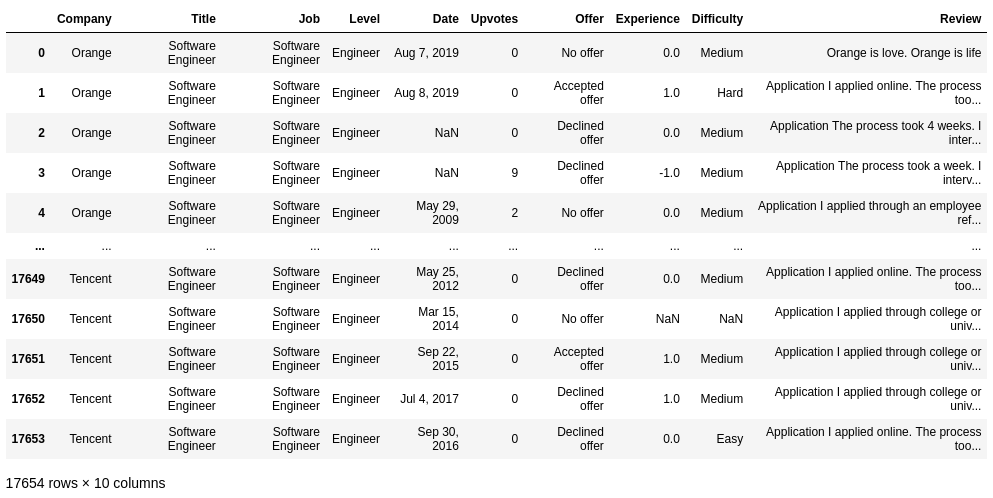
#to drop a labels
df.reset_index(drop=True, inplace=True)
df
String accessor
1
2
#string accessor
df['Review'].str.lower()

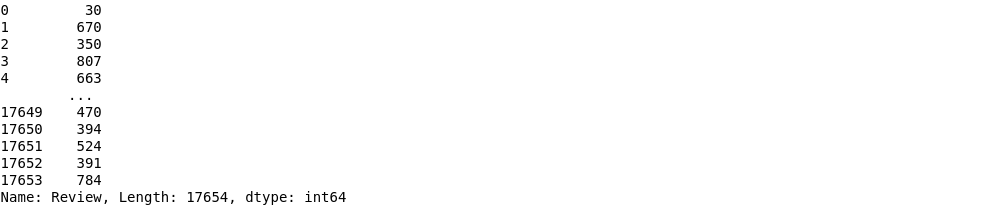
1
df.Review.str.len()
Thêm cột dữ liệu sử dụng regex
1
2
3
4
5
6
7
# them cot Process check str (su dung regex)
df.loc[df['Review'].str.contains('days'), 'Process'] = 'Short'
df.loc[df['Review'].str.contains('week'), 'Process'] = 'Average'
df.loc[df['Review'].str.contains('month|[4-9]+[^ ]* week|[1-9]\d{1,}[^ ]* weeks'), 'Process'] = 'Long'
#set option max col width
pd.set_option('display.max_colwidth', 100)
df[~df.Process.isna()][['Review', 'Process']]
Một số hàm dựng sẵn của str
1
2
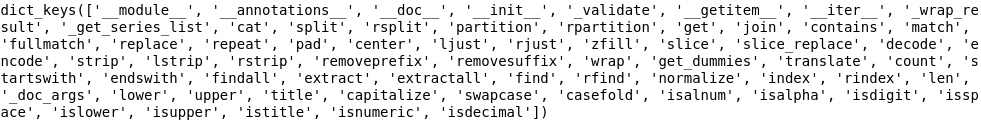
# mot so ham xay dung san cua str
print(pd.Series.str.__dict__.keys())
Data exploration
1
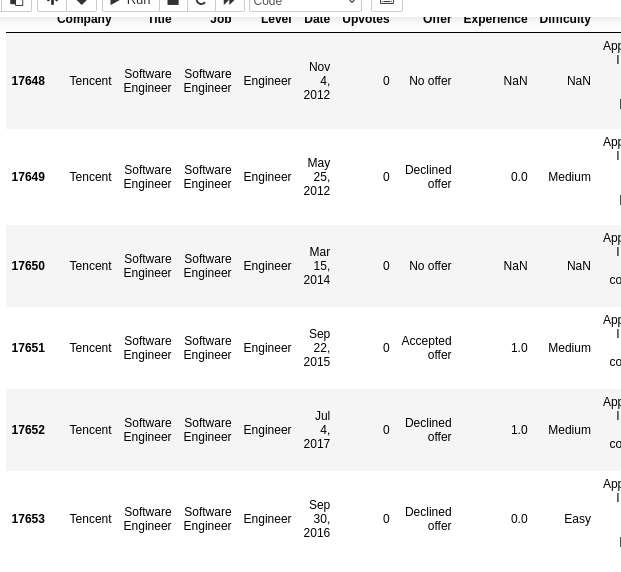
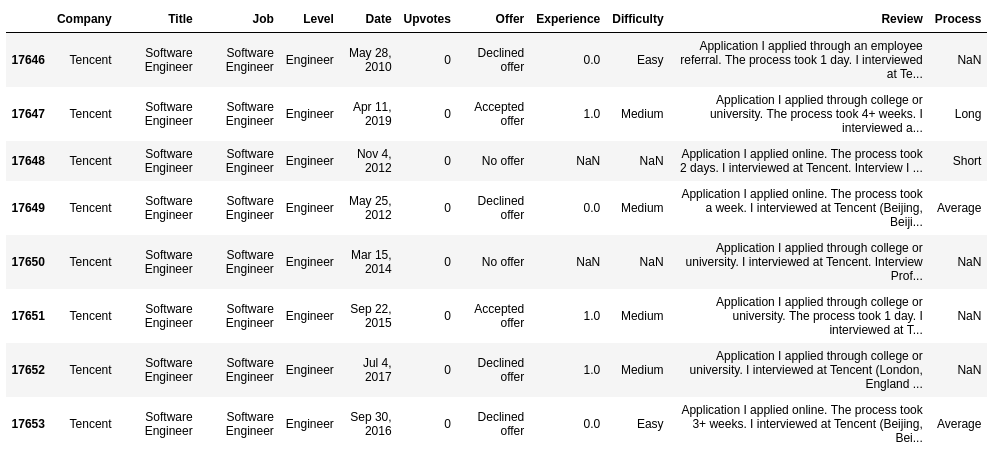
df.tail(8) # lay 8 cai cuoi
Thống kê các thông tin về cột
1
2
# generate statistics about numeric columns
df.describe()

show non-null count and type of all columns
1
2
#show non-null count and type of all columns
df.info()

count unique values
1
2
#count unique values
df.Company.nunique()
count of Company
1
2
#count of Company
df.Company.value_counts()

Groupby and plot
1
2
3
4
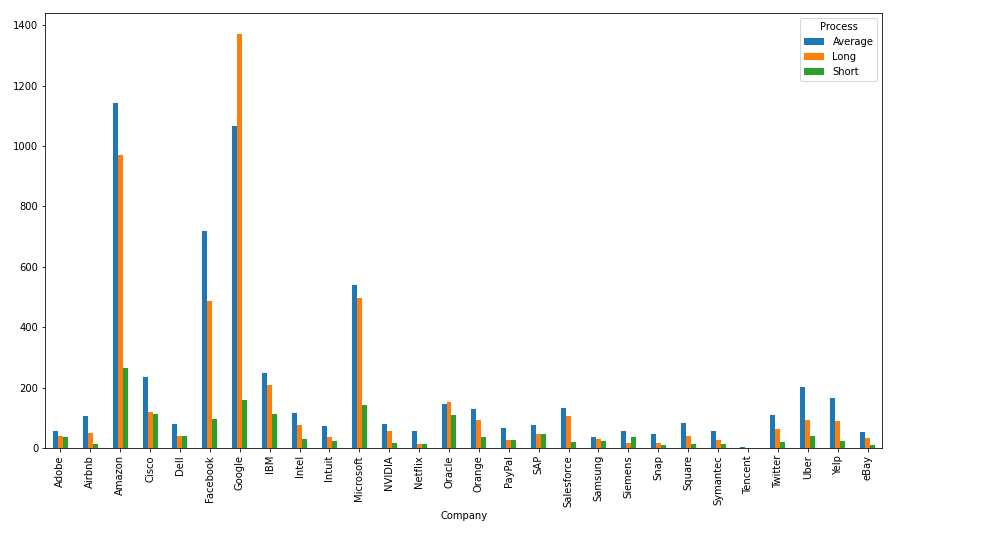
# groupby the df by 'Company' and 'Process', count the number of elements
# then unstack by 'Process' (index 1), plot a bar char
df.groupby(['Company', 'Process']).size().unstack(level=1).plot(kind = 'bar', figsize=(15, 8))
change drop columns
1
2
3
#to make changes to df, set 'inplace = True'
df.drop(columns=['Process'], inplace=True)
df.columns

Link tham khảo
Tài liệu tham khảo
Machine learning cơ bản
Hết.